| T
[`dgr`C] |
Viscosity
[m2/sec] |
|---|---|
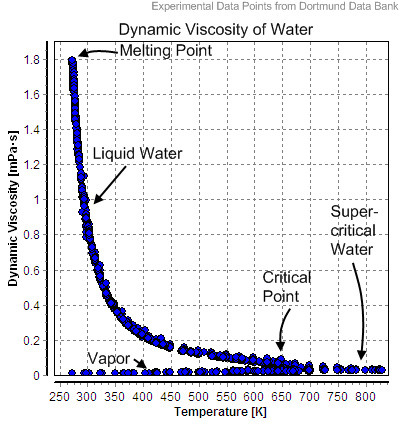
| 10 | 1.308 x 10⁻⁶ |
| 20 | 1.003 x 10⁻⁶ |
| 30 | 7.978 x 10⁻⁷ |
| 40 | 6.531 x 10⁻⁷ |
| 50 | 5.471 x 10⁻⁷ |
| 60 | 4.668 x 10⁻⁷ |
| 70 | 4.044 x 10⁻⁷ |
| 80 | 3.550 x 10⁻⁷ |
| 90 | 3.150 x 10⁻⁷ |
| 100 | 2.822 x 10⁻⁷ |
agraph
setGraphType(LogaritmicLogaritmic);
setViewport(750,550,70);
setGraphArea(2,10,-3,-1);
setGridandTicks(1,1,1,1);
setLabelsandTitle(BottomLeft,"Reynolds number","Friction coefficient","The Moody Diagram");
initPicture();
drawGraphArea();
fill="none";
strokewidth="2";
stroke="blue";
plot("SwameeJain(pow(10,-8),1,x)",log(2320),10);
plot("SwameeJain(pow(10,-7),1,x)",log(2320),10);
plot("SwameeJain(pow(10,-6),1,x)",log(2320),10);
plot("SwameeJain(pow(10,-5),1,x)",log(2320),10);
plot("SwameeJain(pow(10,-4),1,x)",log(2320),10);
plot("SwameeJain(pow(10,-3),1,x)",log(2320),10);
plot("SwameeJain(5*pow(10,-3),1,x)",log(2320),10);
stroke="green";
plot("SwameeJain(pow(10,-2),1,x)",log(2320),10);
plot("SwameeJain(2*pow(10,-2),1,x)",log(2320),10);
plot("SwameeJain(3*pow(10,-2),1,x)",log(2320),10);
plot("SwameeJain(4*pow(10,-2),1,x)",log(2320),10);
plot("SwameeJain(5*pow(10,-2),1,x)",log(2320),10);
stroke="red";
plot("64/x",2,log(2320));
plot("SwameeJain(0.0,1,x)",log(2320),10);
text([10.05,log(SwameeJain(pow(10,-8),1,pow(10,10)))],"`epsilon=10^-8`","middleright","espsilon_-8");
text([10.05,log(SwameeJain(pow(10,-7),1,pow(10,10)))],"`epsilon=10^-7`","middleright","espsilon_-7");
text([10.05,log(SwameeJain(pow(10,-6),1,pow(10,10)))],"`epsilon=10^-6`","middleright","espsilon_-6");
text([10.05,log(SwameeJain(pow(10,-5),1,pow(10,10)))],"`epsilon=10^-5`","middleright","espsilon_-5");
text([10.05,log(SwameeJain(pow(10,-4),1,pow(10,10)))],"`epsilon=10^-4`","middleright","espsilon_-4");
text([10.05,log(SwameeJain(pow(10,-3),1,pow(10,10)))],"`epsilon=10^-3`","middleright","espsilon_-3");
text([10.05,log(SwameeJain(5*pow(10,-3),1,pow(10,10)))],"`5*10^-3`","middleright","espsilon_-53");
text([10.05,log(SwameeJain(pow(10,-2),1,pow(10,10)))],"`epsilon=10^-2`","middleright","espsilon_-2");
text([10.05,log(SwameeJain(5*pow(10,-2),1,pow(10,10)))],"`5*10^-2`","middleright","espsilon_-52");
text([10.05,log(SwameeJain(pow(10,-1),1,pow(10,10)))],"`epsilon=10^-1`","middleright","espsilon_-1");
text([2.1,-2.5],"Laminar","rightmiddle","laminar");
text([6,-2.5],"Turbulent","rightmiddle","turbulent");
createGradient("5%","#EEEEEE","95%","#AAAAAA","MyGradient");
setGradient("MyGradient",0.3);
axesBorder("2","black");
createGradient("5%","#DDDDDD","95%","#AAAAAA","MyGradient2");
setGradient("MyGradient2",0.3);
viewportBorder("3","black");
endagraph
Pointer coordinates: (x,y) Click coordinates: (x,y)
|
Press the left mouse button and move over the Moody Diagram, see the transition between laminar and turbulent flow. |
||||||||||||||||||||
Hydraulic diameter `Dhr` and `Rhr` for river or channel flow or TSHD flow,
or `Dhp` and `Rhp` for pipe flow
Remark: In civil engineering the hydraulic radius `R_h` is `1/4` of the hydraulic diameter `D_h` because this way it matches the depth `H` of a river or channel, while in mechanical engineering it is `1/2` the hydraulic diameter `D_h`, matching the radius `R` of a pipe.
Relative roughness `epsilon=d/D_h`
Reynolds: `Reynolds` for calculating the horizontal axis
Swamee Jain: `SwameeJain` for calculating the friction coefficient `lambda`
|
|
 |
The original
ASCIIMathML and
ASCIIsvg
scripts have been developed by by
Peter Jipsen,
Chapman University (jipsen@chapman.edu) LaTeXMathML has been developed by Douglas Woodall (and exteded by Jeff Knisley), based on ASCIIMathML The version of ASCIIMathML used here, is a modified and extended version, developed by Dr.ir. S.A. Miedema Other sources: An ASCIIsvg manual by Robert Fant. An ASCIIsvg manual by Peter Jipsen. An ASCIIMathML manual by James Gray.
Plugins and fonts required (depending on your browser):
MIT MathML
font packages,
MathPlayer,
Adobe SVGviewer Department of Marine & Transport Technology, The Chair of Dredging Engineering |
|